Tag Manager Debug: Complete Guide for B2B Tracking
Tracking the effectiveness of your B2B outbound campaigns requires precision. When you're working with high-value prospects-companies that just announced a Series B funding round or hired a new VP of Sales-every interaction counts. Your tracking infrastructure must accurately capture these critical touchpoints. That's where mastering tag manager debug becomes essential. Whether you're monitoring LinkedIn engagement, tracking triggered outreach sequences, or measuring conversion points in your sales funnel, Google Tag Manager's debugging capabilities ensure your data collection works flawlessly before you push configurations live.
Understanding Tag Manager Debug Fundamentals
Tag manager debug represents the systematic process of validating, testing, and troubleshooting your Google Tag Manager implementation. This critical workflow ensures every tag fires correctly, data flows accurately to your analytics platforms, and tracking captures the precise moments that matter for your business decisions.
The debugging process operates through a specialized preview mode that creates a live testing environment. When activated, this mode allows you to interact with your website while simultaneously monitoring tag behavior in real-time. Every click, form submission, and page view triggers events that you can inspect before committing changes to production.
Why Debug Mode Matters for B2B Tracking
B2B sales cycles demand precision that consumer-facing businesses rarely require. When your average contract value reaches six or seven figures, missing a single conversion event or misattributing a lead source creates costly blind spots in your data.
Consider tracking a prospect who discovered your solution through a podcast mention, visited your pricing page, and submitted a demo request. Each touchpoint requires accurate tagging. If your LinkedIn conversion pixel fires prematurely or your CRM integration fails to capture UTM parameters, you lose the attribution chain that justifies your marketing spend.
Key debugging priorities for B2B environments include:
- Validating lead form submissions across multiple platforms
- Confirming LinkedIn Insight Tag fires on conversion pages
- Testing CRM integration points where lead data transfers
- Verifying event parameters capture campaign attribution details
- Ensuring consent mode respects privacy requirements
Previewing tags in Google Tag Manager becomes particularly crucial when you're tracking sophisticated buyer journeys that span weeks or months.
Activating Tag Manager Debug Mode
The preview functionality in Google Tag Manager creates an isolated testing environment that doesn't affect your live tracking. This separation proves essential when you're implementing changes to mission-critical conversion tracking or updating data layer configurations that feed your sales intelligence platforms.
Step-by-Step Preview Activation
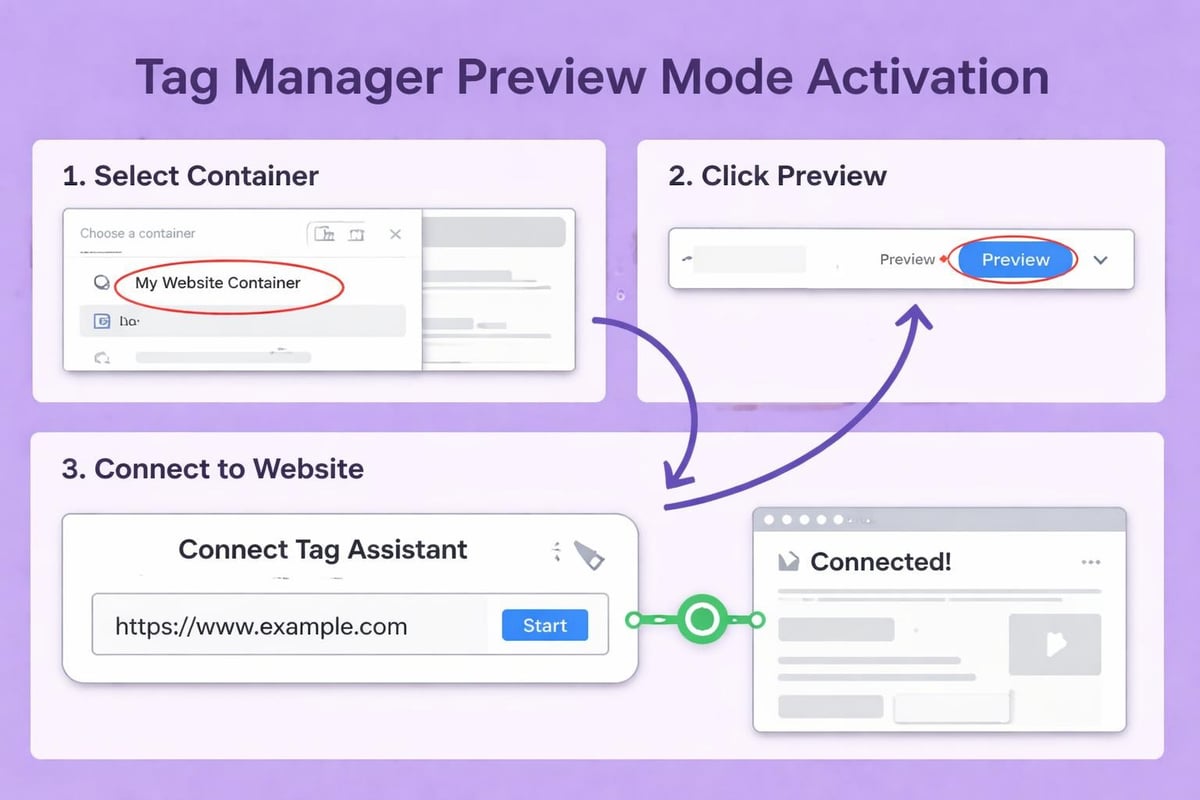
Navigate to your Google Tag Manager container and locate the Preview button in the top-right corner of the interface. Clicking this button launches the Tag Assistant interface, which replaced the legacy preview mode in 2020 with significantly enhanced capabilities.
- Click Preview in your GTM container workspace
- Enter your website URL in the Tag Assistant connection dialog
- Click Connect to establish the debug session
- Interact with your site while monitoring tag activity
- Review firing patterns across different user interactions
The connection establishes a real-time link between your website and the debugging interface. As you navigate pages, submit forms, or trigger custom events, Tag Assistant displays exactly which tags fired, which didn't, and why.
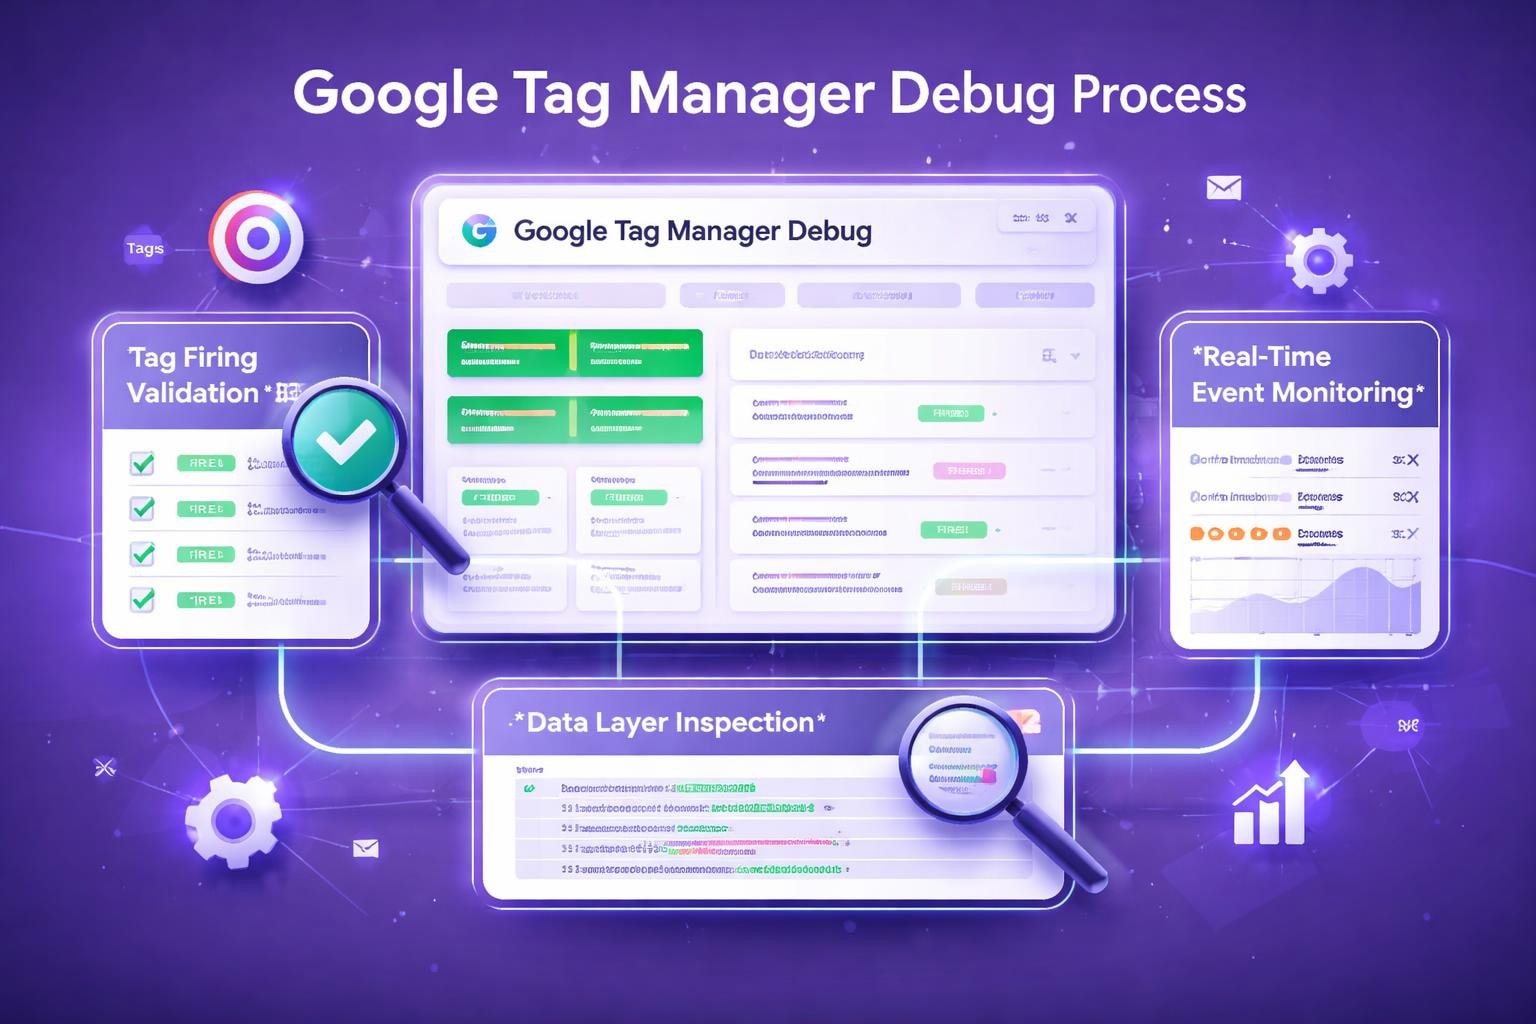
Understanding the Debug Interface Layout
The modern Tag Assistant interface divides into several distinct panels that each serve specific debugging purposes. The left sidebar shows your browsing timeline-every page view and event your session generates. The center panel displays detailed information about tag firing for the selected event.
| Interface Section | Purpose | Key Information |
|---|---|---|
| Timeline Panel | Shows chronological event sequence | Page views, custom events, form submissions |
| Summary Panel | Displays tag firing overview | Tags fired, not fired, failed |
| Tag Details | Provides specific tag information | Variables, triggers, firing conditions |
| Data Layer | Shows data layer state | Variables and values at event time |
| Errors Panel | Highlights implementation issues | JavaScript errors, blocked requests |
This layout allows you to quickly identify whether your conversion tracking tags fire when prospects request demos or whether your remarketing pixels capture the right audience segments for your trigger-based outbound campaigns.
Diagnosing Common Tag Manager Debug Issues
Tag manager debug sessions reveal patterns in tag failures that experienced implementers recognize immediately. Understanding these common issues accelerates troubleshooting and prevents repeated mistakes across container versions.
Tags Not Firing on Expected Events
The most frequent debugging scenario involves tags that should fire but don't. This typically stems from trigger configuration mismatches. Your trigger might listen for a specific button click, but the actual DOM element uses different classes or IDs than your trigger specifies.
Systematic diagnosis approach:
- Verify the trigger conditions match actual page elements
- Check variable values populate correctly at firing time
- Confirm tag firing priority doesn't create sequencing issues
- Review built-in variable enablement for required data points
- Test in both desktop and mobile viewport configurations
When tracking high-value B2B interactions like booked consultation requests, trigger precision matters enormously. A misconfigured trigger on your demo booking confirmation page means lost attribution for your best-performing outbound sequences.
Data Layer Variables Returning Undefined
Data layer debugging represents another critical tag manager debug skill. Your custom events might fire perfectly, but if the data layer variables contain undefined values, your analytics platforms receive incomplete data.
The Variables panel in Tag Assistant shows exactly what values each variable contains at the moment a tag fires. When you see "undefined" instead of expected values, several culprits commonly appear:
- Timing issues: The tag fires before your data layer push executes
- Naming mismatches: Variable names don't match data layer keys exactly
- Path errors: Nested data layer objects require correct path notation
- Type conflicts: Expected strings arrive as arrays or objects
Enabling debug mode properly helps you catch these variable issues before they corrupt your conversion data.
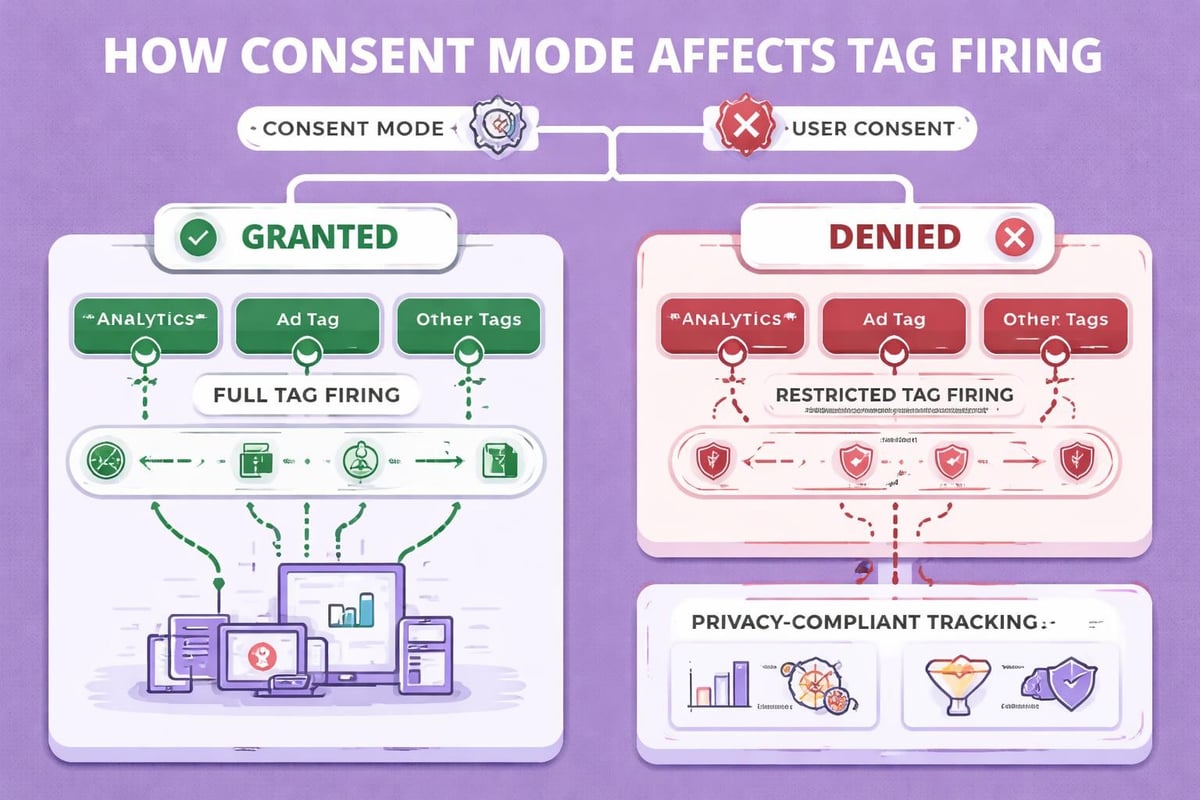
Consent Mode Blocking Tag Execution
Privacy regulations increasingly affect tag behavior. Your tag manager debug sessions must account for consent states that determine which tags can fire. A prospect might decline analytics cookies, preventing your engagement tracking tags from executing even when triggers fire correctly.
The debugging interface clearly indicates when consent mode blocks a tag. Tags appear in the interface but show a consent-denied status instead of successful firing. Troubleshooting consent mode issues requires understanding both your consent management platform and Google's consent framework.
Advanced Tag Manager Debug Techniques
Beyond basic preview mode, sophisticated tag manager debug approaches leverage browser developer tools, third-party extensions, and strategic testing methodologies that catch edge cases before they affect production data.
Browser Console Integration
The browser's JavaScript console provides additional debugging context that Tag Assistant doesn't always surface. Opening the console during your debug session reveals JavaScript errors that might interfere with tag firing, data layer pushes that your custom code executes, and network requests that tags generate.
Console debugging commands:
// View current data layer state
console.log(window.dataLayer)

// Monitor data layer pushes in real-time
window.dataLayer.push = function() {
  console.log('Data layer push:', arguments);
  Array.prototype.push.apply(window.dataLayer, arguments);
}
These commands expose the underlying tag manager debug mechanics that drive tag behavior. When your AI sales tools integrate with your website through custom events, console monitoring confirms those integrations push data correctly.
Network Tab Analysis
The Network tab in browser developer tools shows every HTTP request your tags generate. This proves invaluable when debugging tracking pixels, conversion APIs, and third-party integrations that GTM fires.
Filter the network requests by "XHR" or search for specific domains like "google-analytics.com" or "linkedin.com" to isolate tag-related traffic. Examining request headers, payload data, and response codes reveals whether tags successfully transmit data to destination platforms.
| Network Analysis Element | What It Reveals | Debugging Value |
|---|---|---|
| Request URL | Tag destination and parameters | Confirms correct tracking endpoint |
| Status Code | Server response to tag request | Identifies failed or blocked requests |
| Request Payload | Data transmitted by tag | Validates parameter values and formats |
| Response Headers | Server acknowledgment details | Troubleshoots CORS and security issues |
| Timing | Request duration and sequencing | Optimizes page load performance |
GTM Debug Extensions
Specialized browser extensions enhance tag manager debug capabilities beyond native functionality. The GTM Debug Extension for Chrome provides additional context about container versions, workspace changes, and tag configurations directly in your browser toolbar.
These extensions offer quick reference without switching between tabs. When you're testing complex tag sequences across multiple pages-like tracking a prospect's journey from your outbound sales strategies content through to conversion-extensions streamline the debugging workflow.
Server-Side Container Debugging
Server-side Google Tag Manager introduces additional complexity that requires specialized debugging approaches. Unlike client-side containers that execute in the browser, server-side containers process requests on Google Cloud infrastructure or your own servers.
Preview Mode for Server Containers
Server-side debugging operates through a similar preview interface but focuses on incoming HTTP requests rather than browser events. You'll inspect how client-side requests transform as they pass through your server container to destination platforms.
The server-side preview mode requires sending requests to your server container URL with specific debug parameters. This creates a session where you can monitor:
- Incoming request payloads from client containers or apps
- Transformation logic applied by server-side tags and variables
- Outbound requests sent to analytics and marketing platforms
- Claim processing and enrichment performed server-side
- Response data returned to clients
Server-side debugging proves essential when:
- Implementing conversion APIs that bypass browser limitations
- Enriching data with server-side lookups or calculations
- Managing sensitive data that shouldn't expose client-side
- Optimizing attribution for B2B journeys with long sales cycles
- Reducing client-side JavaScript for performance optimization
Testing Server-Side Tag Transformations
Server containers often transform data before forwarding it to destination platforms. A common pattern involves receiving basic event data from the browser, enriching it with user information from your CRM, and sending enhanced conversion data to advertising platforms.
Tag manager debug for these scenarios requires validating both input and output. The preview interface shows the original incoming request alongside the transformed outbound requests. Compare these to confirm your transformation logic executes correctly and produces the expected parameter values.
Debugging Multi-Domain Tracking Implementations
B2B companies frequently operate multiple domains-a main website, a separate documentation portal, a customer dashboard, and perhaps subdomain-based landing pages for specific campaigns. Cross-domain tracking ensures users moving between these properties maintain consistent session identification.
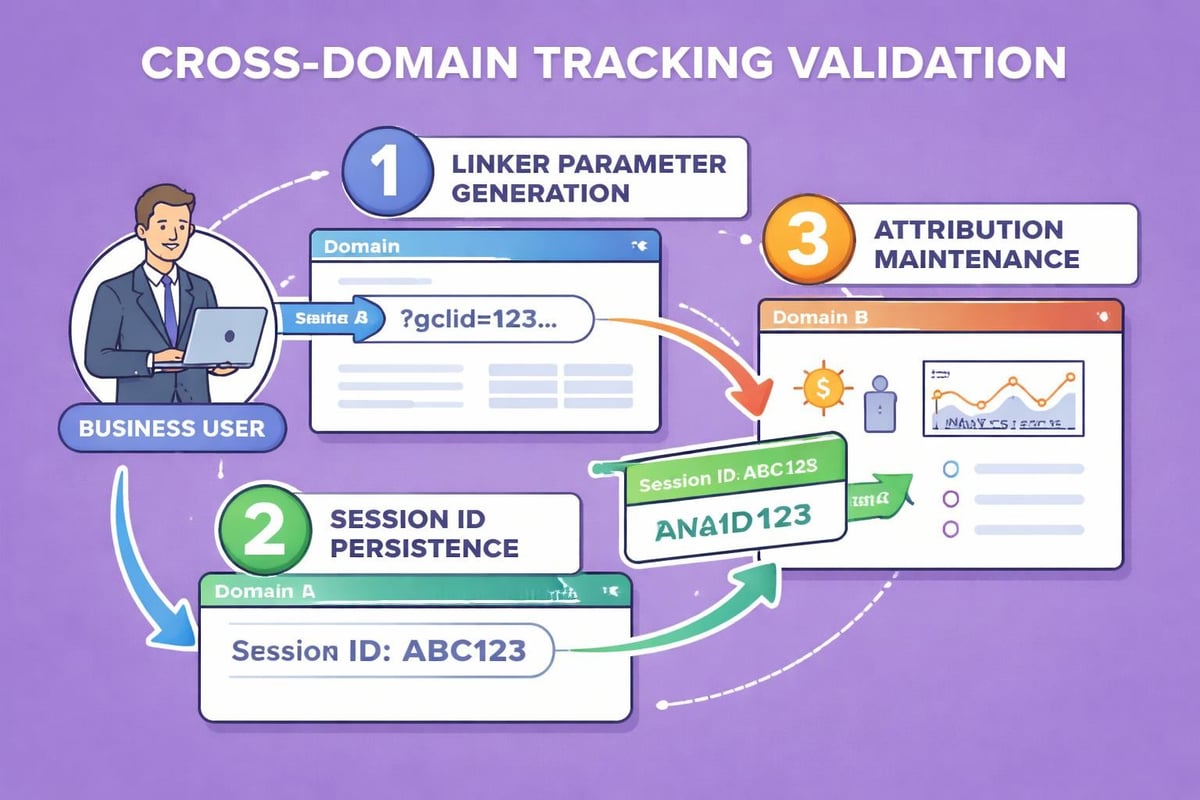
Cross-Domain Tag Validation
Tag manager debug becomes more complex when testing across multiple domains. You need to verify that your Google Analytics tag correctly decorates outbound links, that sessions persist across domain boundaries, and that conversion attribution connects to the original referral source.
Testing cross-domain implementations requires:
- Enabling linker parameters in your GA4 Configuration tag
- Configuring accepted domains in your tag settings
- Testing link decoration by inspecting URLs as you navigate
- Verifying session continuity through GA4 DebugView
- Confirming attribution preservation for multi-domain journeys
Preview mode shows whether your linker tags fire when users click cross-domain links. The Variables panel displays the decorated URL with its linker parameter before navigation occurs, confirming the parameter generation works correctly.
Subdomain Cookie Scope Testing
Cookie scope configurations significantly affect cross-domain tracking reliability. Tag manager debug sessions should verify that your first-party cookies set at the appropriate domain level to encompass all relevant subdomains.
Inspect cookie settings in your browser's developer tools while in preview mode. Confirm the domain attribute matches your intended scope and that cookie values persist as expected when navigating between subdomains. This prevents session fragmentation that artificially inflates user counts and breaks conversion paths.
Form Tracking Debug Procedures
Form submissions represent critical conversion points in B2B tracking. When a prospect requests a demo, downloads a whitepaper, or books a consultation call, accurate form tracking captures that high-intent action. Tag manager debug processes must rigorously validate form submission tags.
Auto-Event Variable Configuration
Google Tag Manager's built-in form submission trigger fires automatically when users submit forms. However, extracting specific form field values requires configuring auto-event variables that capture form element properties.
Essential form debugging checks:
- Verify the form submission trigger fires on actual form submits
- Confirm auto-event variables capture intended form field values
- Test both successful submissions and validation error scenarios
- Check that tags don't fire on spam bot form interactions
- Validate data layer enrichment with form submission details
Preview mode displays all auto-event variables alongside form submission events. Review these values to ensure your lead data includes crucial qualification information like company size, industry, and specific pain points that your outbound team needs for personalization.
Preventing Duplicate Form Submissions
A common debugging scenario involves tags firing multiple times for a single form submission. This creates duplicate conversions in your analytics and potentially sends redundant data to your CRM or marketing automation platform.
Tag manager debug helps identify duplicate firing causes. Often, the issue stems from multiple conflicting triggers or tags that both respond to form submissions. The Tags Fired panel clearly shows if the same tag fires twice for a single event, directing you to the trigger configuration that requires adjustment.
Real-Time Debugging for Dynamic Content
Modern B2B websites increasingly use dynamic content loading, single-page applications, and progressive enhancement techniques that complicate tag manager debug processes. Traditional page view tracking misses content changes that don't trigger full page loads.
History Change Detection
Google Tag Manager includes a History Change trigger that fires when single-page applications update the URL without reloading the page. Debugging these implementations requires understanding how your application manages routing and whether it fires the necessary events for GTM to detect navigation.
Preview mode shows history change events alongside traditional page views in your event timeline. Verify that these events fire at the appropriate moments and that your virtual page view tags respond correctly to application navigation.
Custom Event Validation
Many B2B tracking implementations rely on custom events pushed to the data layer programmatically. These might track video engagement, calculator interactions, chatbot conversations, or personalized content recommendations-all crucial signals for understanding prospect intent.
Tag manager debug for custom events requires close coordination with your development team. Confirm that:
- Custom events push with consistent naming conventions
- Event parameters contain expected data types and formats
- Timing allows tags to receive complete data before firing
- Error handling prevents failed pushes from breaking tracking
The data layer panel shows custom event structures exactly as your code pushes them, making it straightforward to identify discrepancies between expected and actual implementations.
Debugging Tag Sequencing and Dependencies
Complex tag implementations often involve dependencies where one tag must fire before another. Your CRM integration tag might need to fire after your analytics tag captures the conversion, or your remarketing pixel might require data from a preceding tag.
Tag Firing Priority Configuration
Google Tag Manager allows you to set firing priority values that determine execution order when multiple tags respond to the same trigger. Higher priority values fire first. Tag manager debug clearly displays firing order through timestamps and sequence indicators.
Testing priority configurations requires attention to millisecond-level timing details. The debugging interface timestamps each tag firing, allowing you to confirm that dependent tags execute in the correct sequence. When tags depend on values set by earlier tags, incorrect sequencing produces undefined variables or failed API calls.
Synchronous vs. Asynchronous Execution
Tags can fire synchronously (blocking subsequent tags until completion) or asynchronously (executing in parallel). This distinction affects both page performance and tag dependencies. Debugging helps you optimize this balance for your specific implementation.
Sequencing considerations for B2B tracking:
| Scenario | Recommended Approach | Debug Validation |
|---|---|---|
| CRM lead creation | Synchronous, high priority | Confirm tag completes before page change |
| Analytics page view | Asynchronous, standard priority | Verify firing doesn't block rendering |
| Conversion API call | Synchronous if redirect follows | Test that redirect waits for completion |
| Remarketing pixel | Asynchronous, low priority | Confirm firing doesn't delay interactions |
| A/B test assignment | Synchronous, highest priority | Validate experiment before content loads |
Container Version Testing and Rollback
Tag manager debug extends beyond individual tag testing to encompass entire container version validation. Before publishing changes that affect your conversion tracking or lead attribution, comprehensive version testing prevents breaking production implementations.
Workspace Preview Comparison
Google Tag Manager workspaces allow multiple team members to develop changes independently. Debugging workspace versions before merging prevents conflicts and validates that combined changes work harmoniously.
The preview interface clearly indicates which workspace version you're testing. Compare behavior between your workspace and the published container by switching preview sessions. This identifies whether your changes introduce new issues or resolve existing bugs.
Version Rollback Procedures
Despite thorough tag manager debug processes, occasionally a published version introduces unexpected issues. GTM's version history allows instant rollback to any previous container version, but debugging helps you identify exactly which version introduced problems.
When investigating production issues, recreate the problem in preview mode using historical versions. The debugging interface works identically with older container versions, allowing you to pinpoint exactly which tag changes caused regression.
Debugging Tag Performance and Loading
Tag manager debug isn't solely about functionality-performance debugging ensures your tracking implementation doesn't degrade user experience or page load times. For B2B sites where prospects research extensively before converting, page performance directly impacts conversion rates.
Measuring Tag Load Impact
The browser's Performance tab quantifies how much each tag affects page load. During tag manager debug sessions, record performance profiles and identify tags that consume excessive resources or block critical rendering.
Tags that load large JavaScript libraries, make synchronous API calls, or execute complex logic contribute to page slowdown. The debugging process should evaluate whether these performance costs justify the tracking value they provide, particularly for high-ticket sales scenarios where prospect experience matters enormously.
Optimizing Tag Loading Strategy
Google Tag Manager offers multiple tag loading strategies-pageview, DOM ready, window loaded, and custom events. Tag manager debug helps you optimize these choices for both performance and data accuracy.
Preview mode timestamps reveal exactly when each tag fires relative to page loading milestones. Tags that don't require immediate execution should fire after the window loads, preserving initial page interactivity. Conversely, tags that affect visible content must fire early enough to prevent layout shifts or content flashing.
Validating Enhanced Measurement and Events
Google Analytics 4's enhanced measurement automatically tracks specific interactions without custom tag configuration. However, this automation requires validation through tag manager debug to ensure it captures the events that matter for your business context.
Enhanced Measurement Event Inspection
Enhanced measurement tracks scrolling, outbound clicks, site search, video engagement, and file downloads automatically. Your tag manager debug sessions should verify these automatic events fire correctly and capture the parameter data you need for analysis.
The preview interface shows enhanced measurement events alongside your custom events. Confirm that scroll tracking fires at meaningful depth thresholds, that outbound link tracking excludes internal navigation, and that file download tracking captures document types relevant to your lead nurturing process.
Custom Event Parameter Validation
Beyond automatic events, your implementation likely includes custom events with specific parameters that capture business context. A "demo_requested" event might include parameters for industry, company size, and specific product interest-crucial qualification details for your sales team.
Tag manager debug allows you to inspect these parameter values in real-time. Submit test forms with various input combinations and verify that parameter values accurately reflect the submitted data. This validation prevents scenarios where your sales team receives leads without the context needed for effective personalized outreach.
Testing Tag Manager Across User Conditions
Comprehensive tag manager debug requires testing under varied user conditions that reflect your actual audience. B2B prospects access your site from different devices, browsers, geographic locations, and network conditions-each potentially affecting tag behavior differently.
Multi-Browser and Device Testing
Tags that work perfectly in Chrome desktop might fail in Safari mobile due to Intelligent Tracking Prevention or cookie restrictions. Your debugging process must include testing across major browser engines and device types.
Systematic cross-browser debugging:
- Test in Chrome (Blink engine) with standard privacy settings
- Validate in Safari (WebKit) with ITP active
- Confirm in Firefox with Enhanced Tracking Protection
- Check mobile browsers including in-app browsers
- Test with common browser extensions and ad blockers active
Preview mode works identically across browsers, but tag behavior may vary significantly. The debugging interface reveals browser-specific failures that require conditional tag configuration or alternative implementation approaches.
Geographic and Network Condition Simulation
B2B prospects often access your site from corporate networks with strict security policies, VPNs that obscure location, or bandwidth-constrained connections. Tag manager debug should account for these real-world conditions.
Browser developer tools allow throttling network speed to simulate slower connections. This reveals whether tags fail gracefully when network requests timeout or whether they break critical user interactions. For international B2B companies, testing from different geographic regions exposes region-specific blocking or latency issues.
Mastering tag manager debug transforms tracking from a liability into a strategic asset for your B2B growth. The techniques covered ensure your data foundation remains reliable as you scale operations and implement sophisticated attribution models. When your outbound strategy depends on identifying precise triggers-fundraising announcements, hiring patterns, content engagement-flawless tracking becomes non-negotiable. Samplead combines trigger-based prospecting with human-empowered sales teams, automating the identification of high-value moments while keeping your experts in control of the conversation. Our approach prioritizes quality interactions over volume, ensuring every outreach happens at exactly the right moment with perfect attribution tracking.