
Analyze, Iterate, Optimize
Spear's Analytics shows you what actually drives pipeline – with full funnel visibility, campaign-level breakdowns, and ICP refinement insights you can act on immediately.
- 2,000Sent
- 1,000Connected
- 700Replied
- 350Booked
- 400Interested
Trusted by teams who refuse to compromise on data, control, or cost.

"When it's short and has a specific ask, you see 22%, 30% reply rates."


"Top of funnel was our biggest challenge. Now it's our biggest asset."


“Of all my lead gen technologies, it's number one”


"When it's short and has a specific ask, you see 22%, 30% reply rates."

"It's almost like a Chief of Staff for LinkedIn. Countless meetings booked, from CISOs at Fortune 500 companies to top industry leaders."


How it works

Funnel View: Track growth over time
A visual bar chart shows your prospect journey from send to booked meeting, with period-over-period comparisons so you can spot trends, identify drop-offs, and measure momentum. See if your connect rate is improving, if replies are increasing, or if booking rates are stalling.
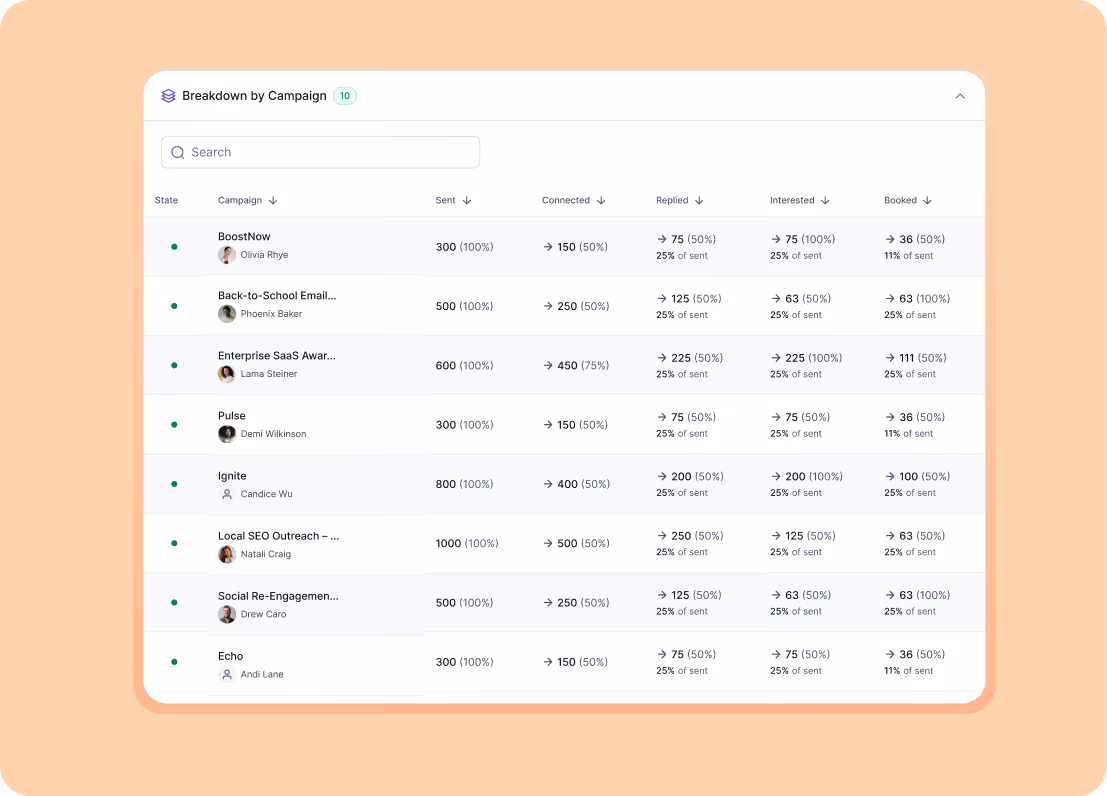
Breakdown by Campaign: Granular performance by strategy
Every campaign gets its own performance row. Compare messaging approaches, test different ICP segments, or see which triggers drive the highest reply rates. This is where A/B testing becomes actionable – you're not guessing which campaign works better, you're looking at the data.

Pipeline Health & Efficiency: Quality, not just volume
Track how efficiently you're using your daily send capacity. Spear shows your Potential (prospects queued), Review Rate (how fast you're approving), and Approval Rate (ICP accuracy). These metrics tell you if you're maximizing your 20 sends per day or leaving opportunity on the table.

Top Denial Reasons: Refine your ICP in real time
A bar chart shows why you rejected prospects – wrong title, wrong industry, wrong company size, etc. Use this to tighten your ICP definition, adjust campaign filters, and reduce time spent reviewing bad-fit leads. Every denial is feedback that makes your targeting sharper.

Export to CSV for deeper analysis
Need to build custom reports, share data with leadership, or integrate with your BI tools? Export your analytics to CSV with one click. All your funnel metrics, campaign breakdowns, and pipeline health data download instantly.

FAQs
Contact us if you have any other questions.
Analytics refresh in real time. Every connection acceptance, reply, and meeting booking updates your dashboard immediately.
Yes. The Funnel View allows you to compare current performance against previous periods (week-over-week, month-over-month) so you can track trends and measure growth.
The Breakdown by Campaign section shows individual stats for each campaign – sends, connects, replies, interested, booked. Sort by reply rate or booking rate to see which messaging or targeting strategy is winning, then double down on what works.
Review Rate measures how quickly you're approving or denying suggested prospects. Approval Rate measures what percentage of prospects you approve vs. reject. High approval rate + high review rate = efficient pipeline. Low approval rate = your ICP needs tightening.
When you include the {calendar_link} placeholder in your messages, Spear generates a unique URL with UTM parameters for each prospect. When they click and book, the system automatically updates their status to "Booked".
Yes. The campaign breakdown lets you see performance by campaign type (including trigger-based campaigns like event attendance, job changes, or podcast appearances). Compare trigger campaigns against general outreach to see what drives the highest conversion.
This means your ICP targeting needs refinement. Work with your Customer Success Manager to tighten title filters, adjust seniority levels, or exclude certain roles. Every denial reason is a signal to make your targeting more precise.

Explore more Spear products
Discover additional Spear capabilities that work seamlessly with needs

Reddit & X
Spear monitors for moments when prospects discuss problems and signal buying intent.
Right place, right time.
Triggers
Spear tracks high-intent signals across your market.Outreach activates only when timing and context align.

Integrations
Connect Spear to your CRM, calendar, and outreach tools. Prospects flow from detection to booked meetings automatically.
Turn triggers into pipeline
With Spear, companies leverage trigger-based outbound to craft a quality-driven GTM motion that actually books meetings.